Liberating Data from ArcGIS
During the George Floyd protests, a collective of artists, hackers, and everything in between built a number of tools for monitoring police actions and helping protesters on the ground. One of these tools is the incredible Scanner Map, a live map of police and protest movements updated by people listening to police scanners (using another part of our infrastructure) for protesters on the ground.
The tool was built quickly for NYC but new features and cities were added over the course of the following week. One of these features added live camera feeds so mappers could check on the ground conditions. This feature was originally rolled out to just NYC, but some ATL mappers requested the capability so I volunteered to fill in the data.
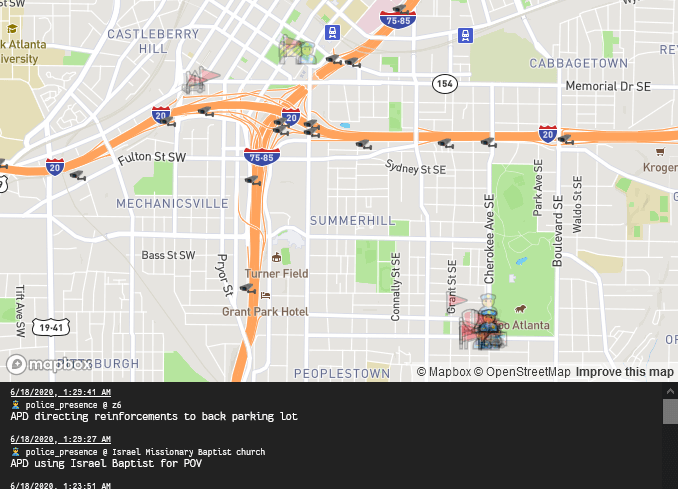
ATL Scan Map
Police scanner data and traffic cams in one place.
Finding Camera Data
The format necessary was simple, a json file of [{"img_url:" "https://example.com/camera-image.jpg", "latitude": 33.9236400, "longitude": -84.25179708}, etc] for every single traffic cam. To create this, we needed to 1) pull the traffic cam data, both url and lat/long 2) turn it into the proper format. Sounds technically daunting, but I want to show how you can do this without having to know any programming or data scraping techniques.
I pulled up the Georgia DOT traffic cam site to see how many cams there were and quickly realized I wasn’t going to do this by hand. Googling, I found several people had made ArcGIS online layers of the traffic cam data with URLs to the live images and geo data placing the cameras. Unfortunately, none of them were enabled for easy download so it was time to dig a little deeper into the site.
Time to Scrape
I ended up choosing this one because I liked their formatting the best (not to mention the ID aacb139077484b71acf626b45cee70b6 was almost acab). Luckily for us, even though there’s no download data button, if you look at the bottom corner, ArcGIS has a “URL” header that if we click brings us to data about this collection (I imagine this page exists because they realize how easy it would be to scrape the data off the map anyway). What we’re interested is at the bottom of the page, where it says “Query” - click that and we’re on a page with a whole bunch of options.
Now here’s where we do a little magic. If you just hit GET at the bottom, you’re going to end up disappointed with no data. We need to hack the URL a little with a custom query to start generating data. Go up to the top URL and add ?where=0%3D0&outFields=%2A&f=html to the end so the new URL looks like https://services7.arcgis.com/DJ0wDKAvwXMSDxfb/ArcGIS/rest/services/ATLMarta/FeatureServer/6/query?where=0%3D0&outFields=%2A&f=html. Hit enter and if you scroll down you should be greeted with a list of results including X, Y, and URL’s, nice! Oh wait, there’s only like 50 results and we can’t access the rest, also what the hell are these X and Y coordinates referring to? We want lat and long.
Time for a little more query hacking. You can do this in the URL or with the HTML page we already have in front of us. For the URL, rewrite it as https://services7.arcgis.com/DJ0wDKAvwXMSDxfb/ArcGIS/rest/services/ATLMarta/FeatureServer/6/query?where=0%3D0&outFields=%2A&f=pgeojson or just swapping that final html for pgeojson. Hit enter and there you have it, a full list (technically up to 1000) of cameras with lat and long.
Let’s explain how we got that. That query we added has three main parts. The where = 0 = 0 (written as where=0%3D0) just grabs every possible point and the outField = * (written as outFields=%2A) tells it not to omit any of the data attributes. These two are basically telling the query function to run with all possible datapoints presented to us. The last element f=pgeojson declares that the format of this data should be geoJSON with that nice lat/long format. You can substitute in html or json but you’ll get those XY points and varying degrees of unnecessary info. Do note that this query is limited to ~1000 data objects being returned so if you have a group larger than that you’re trying to narrow down, you can add limitations to the query by checking the arcGIS query docs (I think this older page is better).
Cleaning and Formatting
Okay, we’ve got this data, now what? It’s not in the right format and there’s a bunch of shit we don’t need. It wouldn’t be too hard for us to write a python script to clean everything up since it’s already in a decent JSON format, but let’s pretend we don’t know how to do that and use simple existing tools to achieve the same thing (and honestly it might even be faster).
JSON to CSV
While JSON is a great format for manipulating data with code, it’s less than ideal for human manipulated stuff. Fortunately, we can easily convert the JSON to CSV or comma separated values with the free online tool JSON-CSV. Just upload and then download the resulting CSV.
Sorting
Now that we have the data in a usable format, we can start to manipulate it. There’s a bunch of cameras we don’t want covering interstates in the middle of nowhere and cities besides Atlanta as well as columns of useless crap. Fortunately, lat/long act as excellent bounding tools and we can remove columns easily.
Open the CSV in your favorite spreadsheet editor (excel, sheets, whatever) and delete all the columns with no data. We just need lat, long and url. Now, let’s go ahead and rename those columns to the format our final JSON (remember that bit way at the beginning) wants (“img_url”, “latitude”, and “longitude”). Now, we can sort by lat either decreasing or increasing. Delete any rows that don’t have lat/long data as they’re useless. Checking the lat on this helpful lat/long finder of the north edge of the perimeter (the bounding highway of Atlanta for non natives) we delete every row with something higher. Then we do the same for the south edge. Sort by Longitude, then do the same process for the east and the west. This left us with ~380 useful cameras and no unnecessary columns, rows, or broken data. Save as a CSV.
Back to JSON
Here’s the really cool part. We’re going to convert this CSV back to JSON, but not just the same format we had before, but the proper JSON to merge with our scanmap. The tool that does this is the appropriately titled Convert CSV to JSON which we’re using because of the powerful templating tool it sports.
Upload the CSV we created above using the “Choose File” input in Step 1. You should see the data populate in step 5, but it’s not the perfect format (though it might work anyway). It’s easy to clean it up though, so let’s do that. Open step 4 and we can create a custom template. The headers (our first column) are referred to as h1, h2, and h3 (header and then the column number) respectively for long, lat, and img_url while the data is called f1, f2, and f3 for field and column number. The formatting is fairly self-explanatory and our data’s template is {lb}"{h3}": "{(f3)==""?"null":f3}", "{h2}": {f2}, "{h1}": {f1}{rb} with {lb} and {rb} referring to the left bracket { and right bracket } respectively. Hit the convert button and download the output.
If you want to minify so it’s all one line, feel free to. This is a decent tool, just check the box “Don’t escape any “/” or your URL’s will break.
Wrap Up
There you go, we successfully found, scraped, cleaned, and formatted data without writing a line of code (unless you count that query). We can add this to the scanmap github, by creating a pull request (which there are plenty of tutorials for) giving crucial camera data to protesters and comms teams to better organize their responses. Hopefully this shows you that you don’t need to know how to code to make important contributions to tools like this.
Thanks to Gary S for the answer that simplified this process for me and kept me from having to read all the ArcGIS query docs.
pig.observer is an incredible traffic camera surveillance tool I wish I had known about before putting this data together (ze already has all this data in nice JSON formats, oh well).